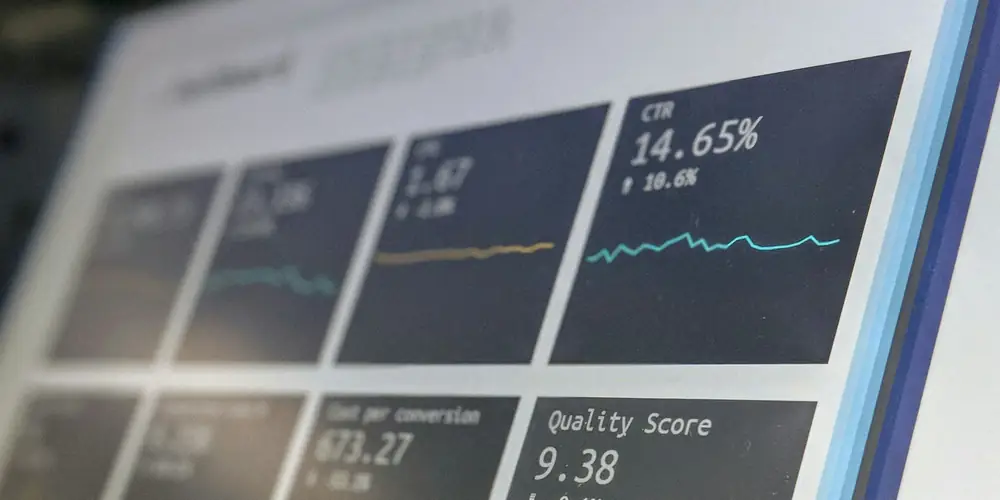
An office TV dashboard is a wall screen that shows a handful of numbers the team cares about and keeps them current without anyone touching it. With SignageStack there are two ways to get the numbers onto the TV:
- Keep them in Google Sheets and show them with the Google Sheets app. The sheet stays private in your Drive, the app checks it every minute, and the screen shows the figures as a clean table.
- Show a dashboard you already have in Power BI, Looker Studio, Grafana, Metabase or your own tool, through the Web page app and the dashboard's public share or embed link. This works only if the page opens without a login and allows itself to be shown inside another page. If it does not, the screen shows blank.
Behind the TV you need a small player, such as an Android TV box or a computer with a browser. The rest of this guide covers both routes, why a logged-in dashboard comes up blank, and how to make the numbers readable from across the room.
Which route suits your office TV dashboard?
| Google Sheets app | Web page app |
|---|---|---|
Where the numbers live | A Google Sheet | A BI tool or web page with a public link |
What the screen shows | Its own table, drawn from the cell values | The page as it looks in a browser |
Charts | No, values only | Yes, whatever the dashboard shows |
How it stays current | The app checks the sheet every minute | Loaded fresh each time it comes on screen |
Who else can see the data | Nobody; the sheet stays private | Anyone who has the public link |
When the network drops | Keeps showing the last figures | Skipped until the connection returns |
If your numbers already end up in a spreadsheet, start with Sheets. If the team already looks at a dashboard with charts, and that dashboard can be shared publicly without a problem, use the Web page app.
Route 1: KPIs from Google Sheets
Build a tab for the screen
The Google Sheets app reads the spreadsheet's first tab: columns A to Z and the first 100 rows, with headings in row 1. So build a tab for the wall and drag it to the front:
- A summary, not the raw data. Five to ten rows is plenty. Formulas that add up or count from the other tabs leave the raw data where it is; the app shows the values the formulas produce.
- Format numbers in the sheet the way you want them read: currency, percentages, thousands separators. The screen keeps the format.
- Put the signal in the cell. Colours, conditional formatting, charts and images stay in the sheet, because the app draws its own table from the values. If a figure needs a verdict, write it as text in the next column: "On track", "Behind", "▲ 4%".
- Keep headings short. They become the column titles. For a plain list you can switch off Show the header row; row 1 is still treated as headings and never shown as data.
Put it on the screen
- In the SignageStack dashboard, open Apps and add Google Sheets.
- Under Google account, sign in once. SignageStack asks for access only to the files you pick, not to your whole Drive.
- Under Spreadsheet, select "Choose from Google Drive" and pick the file in Google's own picker. That one file is all SignageStack can read.
- Pick Light or Dark under Theme to suit the room.
- Add the app to a playlist, give it a duration and publish it to the screen.
From then on, a change in the sheet reaches the screen within about a minute. If the table is longer than fits at a readable size, it is split into pages that turn on their own, so give the app a longer duration to let each page stay up.
Where this route stops
There are no charts, only a table. The app does not connect to your CRM, shop system or accounting software either: the numbers have to reach the sheet somehow, whether someone types them in, a formula imports them or another tool already writes them there. For a small team that is often fine: the numbers may already be in a sheet someone updates every morning.
Route 2: a BI dashboard through the Web page app
Why a dashboard you are logged into shows blank
The screen is not you. It has no login to your BI tool, so the address you see in your own browser leads it to a sign-in page. Most sign-in pages refuse to be shown inside another page, and one that did would wait for a password nobody types. Google's own pages, social networks and most banking sites refuse as well. Nothing in SignageStack can override that.
What the screen needs is a link meant to be opened by anyone and shown inside other pages: a public share link or an embed link. Many BI tools offer one, often behind a setting that an administrator controls.
Where to find the right link
Each tool's own documentation describes its public option:
- Power BI: Publish to web, under File > Embed report > Publish to web (public). Microsoft's documentation warns that anyone on the internet can then view the report without signing in, including detail-level data the report aggregates. Your Power BI administrator has to enable the feature, and the published data is cached for one hour.
- Looker Studio: File > Embed report, then Enable embedding. According to Google's help page, anyone can see the embedded report if it is shared publicly. If it is shared with specific people, they have to be signed in to a Google account, and a screen is not.
- Grafana: externally shared dashboards, formerly called public dashboards. Grafana's documentation says anyone with the URL can open them, and lists what does not work in them, including template variables.
- Metabase: public links. Metabase's documentation says only admins can create them and that they show view-only results.
For your own intranet page or status board, the question is the same: does it open in a private browser window without asking you to sign in?
Public means public
These links work on the screen because they need no login, and that also means anyone who gets hold of the link can open it. Before you publish, look at what the dashboard contains. Revenue by customer, salaries and anything personal should stay off a public link, and off a wall that visitors walk past. Often the right answer is a separate, stripped-down dashboard made for the screen.
Set it up
- Open Apps and add Web page.
- Paste the full public link into Page address, starting with
https://. - Check the preview beside the form. It shows the page as a screen will; if it stays blank there, it will be blank on the wall.
- Add the app to a playlist, give it a duration and publish.
The Web page app runs the page in a closed frame. It cannot navigate the screen away, open pop-ups or start downloads.
How fresh is it?
The page opens when the app comes on screen and closes when it leaves, so each turn shows the dashboard as it is at that moment. A dashboard that refreshes itself keeps doing so while it is showing. The tool's own caching still applies: Microsoft's documentation says Publish to web caches data for an hour and does not recommend it for data that needs to refresh frequently.
Rotate the dashboard with other content
A wall that shows the same table all day becomes furniture. Put the dashboard in a playlist with a few other items:
- the figures, for long enough to read each one twice
- one or two short announcements from the Text app
- today's meeting-room bookings from the Google Calendar app (meeting room display covers this)
- company news from a Google Slides deck (how to display Google Slides on a TV)
Or split the screen with the Zones app: the figures on the larger panel, a clock and the day's calendar beside them. Panels play no sound.
Plan for the network dropping. The Sheets table keeps its last figures, but a Web page item is skipped until the connection returns. If a web dashboard is the only thing in the playlist, add something that plays without a network, like a clock or a short text, so the screen always has something to show.
Make the numbers readable from across the room
- Fewer numbers. Five figures that can be read from a desk are worth more than thirty that cannot.
- Size by distance. A common rule of thumb: the furthest reader should be no more than four screen heights away for anything read line by line, and a table is read line by line. Across an office of three to five metres, that usually means a 43 to 55 inch screen. How to choose a screen size has the full table.
- Full HD is enough for most rooms. 4K does not help people four metres away.
- Design the BI dashboard for a wall. Large tiles, no filters or slicers (nobody can click them), no small axis labels, and a 16:9 page that fills the screen.
- Label every number with what it is and the period it covers: "Orders today", "Revenue this month".
- Remember who walks past. Visitors, cleaners and job candidates see the wall too. Show team figures rather than individual rankings; a league table of people reads as surveillance, whatever the intention. For figures aimed at a warehouse or shop floor, see internal communication screens.
What hardware do you need?
A display with an HDMI input and a player:
- An Android TV box with Android 8 or newer and 2 GB of RAM or more, connected by cable where possible. A box that does the job typically costs somewhere between €40 and €120. A heavy BI dashboard asks more of a small box than a table does, so try yours on one box before buying several; choosing an Android TV box lists what else to check.
- A computer with a browser, such as an old mini PC or a Mac, running the web player full-screen in current Chrome, Edge, Safari or Firefox. It is the quickest way to try this on the TV you already have.
A Samsung or LG smart TV's built-in browser can open the web player, but it will not restart it after a power cut or keep it full-screen, so for a screen that runs unattended, add a small Android box. The hardware page lists what is worth paying for.
Where to start
Choose five numbers. Build a first tab in Google Sheets that shows only those, formatted the way you want them read. Pair a TV with the SignageStack web player on a laptop, add the Google Sheets app and look at it from the far side of the room. If something is hard to read, cut a number rather than shrinking the text.
The trial runs for 21 days with every feature, on one screen, and needs no card. That is enough time to find out whether anyone looks at the numbers, and whether they are the right ones.